Code Coverage Using Clover
What is Code Coverage?
Code Coverage is the percentage of code which is covered by automated tests.
Let's Get Started Code Coverage with Clover
Clover is an industry-leading code coverage tool which allows us to easily measure the coverage of the unit tests, enabling targeted work in unit testing — resulting in stability and enhanced quality code with maximal efficiency of effort. It is an open source product from Atlassian. It has the server edition as well as desktop edition which is available as plugins for Eclipse and IDEA. Clover's Ant and Maven integrations allow coverage measurement to be performed in Automated Build and Continuous Integration systems, and reports generated to be shared by the team.
Download and Configure Clover-for-Eclipse
Download Clover-for-Eclipse from the Clover downloads page.
- Select from the menu "Help > Install New Software ..."
- Click "Add...", next click "Archive..." and point to the location of the downloaded archive. Click "OK".
- Select the entry "Clover <version> (Eclipse 3.6 - 4.3. and RAD 8.0 - 9.0)".
- Deselect the checkbox "Contact all update sites ..." for faster installation.
- Click "Next" twice, select the radio button next to "I accept the license agreement" and click the "Finish".
- Installation process will start.
- You will be asked to install unsigned content. Click "OK".
- You will be asked to restart Eclipse. Click "Restart now" to complete the installation.
Enable Clover for Java project
Right click on a project in "Package Explorer" view, select "Clover > Enable on this Project". If you wish to enable Clover for multiple projects at once, choose "Enable/Disable on...".
Four Clover views will be opened automatically:
- Coverage Explorer
- Test Run Explorer
- Clover Dashboard
- Test Contributions
We can always open them from "Window > Show View > Other ... > Clover":
Build and Run the Application
Build your project as usual. In order to run it, choose "Run with Clover" button from tool bar:
Review Coverage Results
Coverage Explorer
You will see coverage and metrics for all instrumented projects.
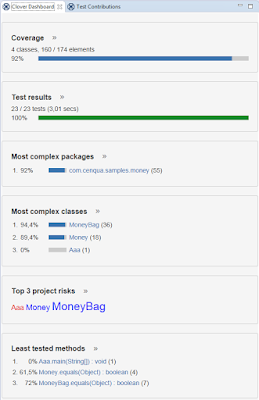
Clover Dashboard
It's a place where you can have a quick overview of your project and find hints about code areas you should focus on:
- Coverage - shows percentage coverage of the project
- Test Results - shows percentage of passed tests as well as duration
- Most Complex Packages - lists several packages with the highest complexity -> refactor
- Most Complex Classes - as above, but on a class level -> refactor
- Top Project Risks - the most complex and the least tested classes -> refactor and/or write more tests
- Least Tested Methods - methods with the lowest test coverage -> write more tests
Java Editor
To view coverage information on a line-by-line basis, Clover adds colored annotations to your project's Java source code editors.
Colors used for background highlighting are as follows:
- Green - Coverage from passing tests or due to execution outside tests (e.g. main() method)
- Yellow - Failed test coverage (where coverage has only been caused by one or more failing tests and no passing tests)s percentage of passed tests as well as duration
- Grey - Filtered out code
- Red - Code with no coverage
Test Run Explorer
The Test Run Explorer view, lets you explore your recently run tests - showing whether they passed or failed, their duration and any error messages that they generated. Furthermore, it allows you to explore the code coverage caused by an individual test, a test class, a package or even your entire project.
After running tests in a Clover-enabled project, on the left-hand side of this view you will see a tree of tests that were run. On selecting an element on the left-hand side, the right-hand side displays all the application (i.e. non-test) classes that had coverage caused by the selection.
The right-hand table displays not only the names of the classes that were partially or fully covered by the test methods, but also the percentage of class' total coverage that is attributable to the test method (the test method's coverage contribution) as well as the percentage of the class' coverage that was attributable only to the selected test method (the test method's unique coverage).
Strengths and Weaknesses of Clover
Strengths
- Easy
of setup the environment
Clover's IDE Plugins provide developers with a way to quickly measure code coverage without having to leave the IDE. Clover provides many ways to fine-tune instrumentation scope, which gives you an ability to concentrate your work on the most important code.
- Compatible with many Platforms
• Java Version
|
JRE / JDK
1.6 - 1.8
|
• Operating Systems
|
Microsoft Windows
Linux
Apple Mac OS X
|
• Build Automation Tools
|
Apache Ant
Apache Maven 2
Apache Maven 3
|
• Integrated Development Environments (IDEs)
|
JetBrains IntelliJ IDEA
Eclipse
|
- Interactive Reporting/Dashboarding Capability
Visual representation, Graphical representation, coverage map, project metrics are all quite superior. Clover can generate multiple types of reports (HTML/XML/PDF). It has great and highly configurable HTML reports (showing not only code coverage but also top risks etc).
Weaknesses
- Supports only Java and Groovy
Alternative Tools
- JaCoCo
- Cobertura
- EclEmma
______________________________________________________________
Tip: You now know basics of Clover for Eclipse plugin - enough to start your daily work with it.


Blackjack Lobby | Mapyro® USA
ReplyDeleteBlackjack Lobby in 강릉 출장안마 Blackjack Lobby has the most tables that you can find 진주 출장마사지 in Las Vegas. 이천 출장안마 There is 당진 출장안마 also a bar and a 충주 출장마사지 casino.